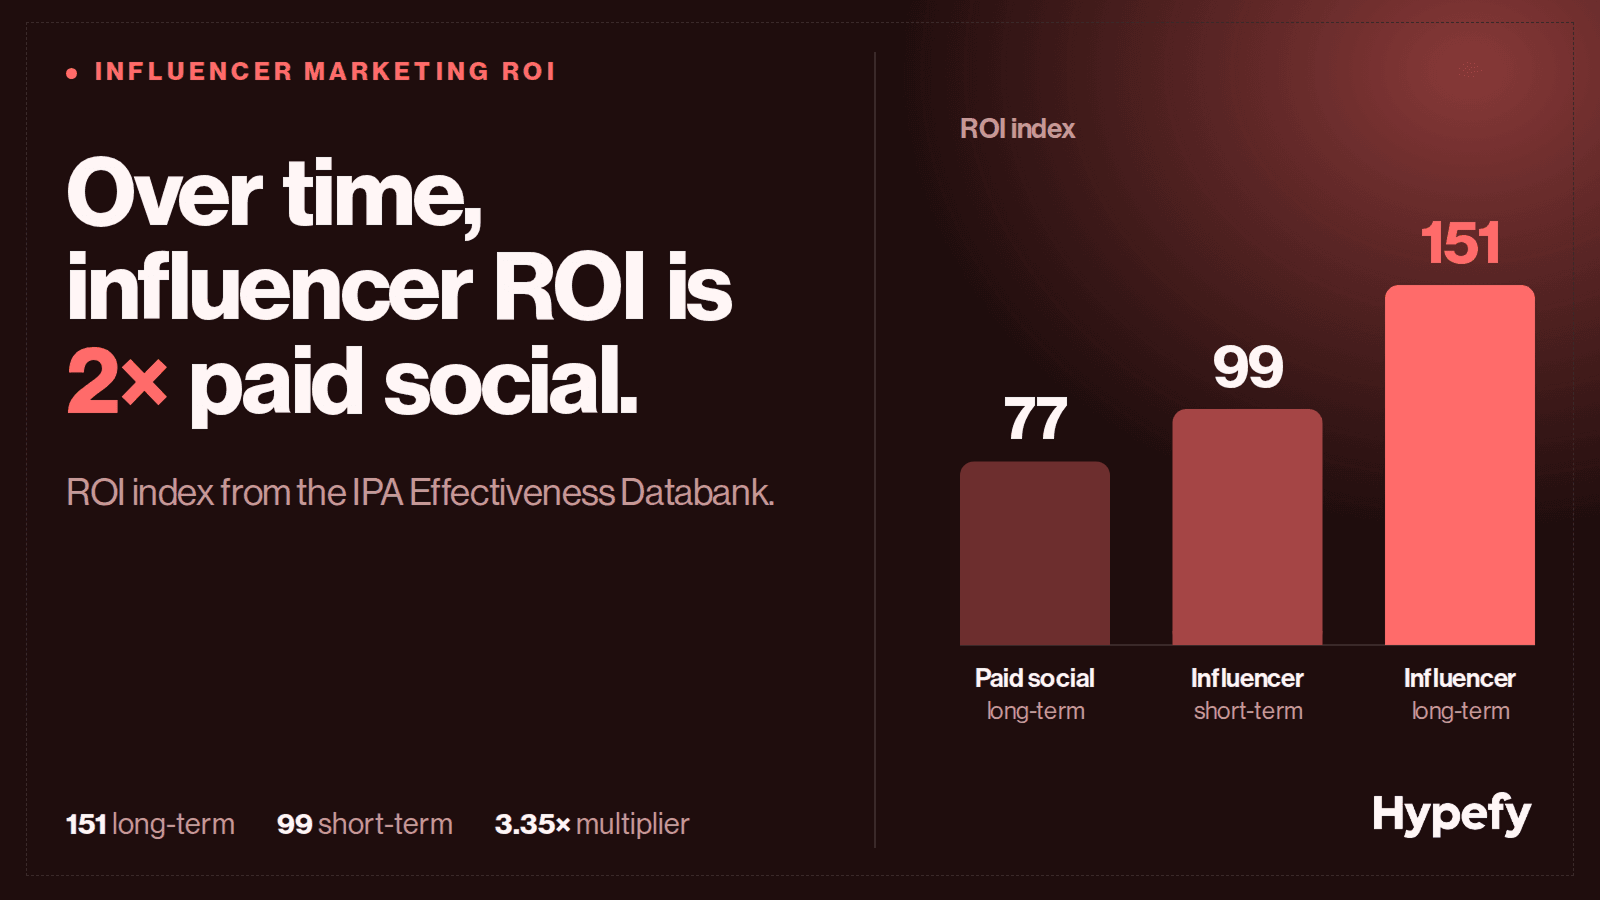
The graphic shows long-term influencer marketing with nearly twice the ROI index of long-term paid social.
Table of ContentsKey Takeaways
The formula is (total return − total cost) ÷ total cost × 100. Total cost has to cover creator fees, product, platform or agency fees, paid amplification, and internal time, rather than creator fees alone.
Returns swing widely from one campaign to the next. A well-matched campaign can earn back many times its cost, while poor creator fit or missing attribution returns close to nothing measurable, which is why any single "industry average" is misleading.
Measurement is a structural problem, and it persists even with tracking in place. Marketers rank measuring ROI and attribution complexity together at 15.84% of the challenges they report, and the full effect is routinely undercounted even so.
The attribution method changes the answer more than campaign quality does. A well-run campaign measured on last-click will show a worse return than a poorly-run one with tracked codes and post-purchase surveys.
Reach-based and sales-based campaigns need different measurement. Applying direct sales attribution to an awareness campaign gives a misleading result either way.
Influencer marketing ROI is the value a campaign returns divided by what it cost, written either as a return multiple (return ÷ cost) or a percentage.
Returns vary widely from one campaign to the next: the strongest campaigns earn back a solid multiple, while a campaign with poor creator fit or missing attribution returns close to nothing measurable.
On top of that, a large share of brands cannot attribute their results properly in the first place. Those two things together are what make measuring influencer ROI a hard question rather than a simple one.
This guide covers the formula, the attribution methods that work and what each one misses, what a realistic benchmark looks like and why most published numbers should be read carefully, and the levers that move the number most.
If you already have your campaign costs and attributed revenue to hand, the ROI calculator does the arithmetic once those inputs are ready.
What Influencer Marketing ROI Is
Influencer marketing ROI is the return a campaign generates relative to what it cost. The formula is:
ROI = (Total return − Total cost) ÷ Total cost × 100
Or as a return multiple: Total return ÷ Total cost
Worked example: A brand spends $3,000 on a campaign: $2,000 in creator fees, $500 in product sent for seeding, $300 in platform fees, and $200 in internal time to manage briefs and approvals. The campaign drives $12,000 in attributed revenue through tracked discount codes. ROI = ($12,000 − $3,000) ÷ $3,000 × 100 = 300%. Return multiple = $12,000 ÷ $3,000 = 4x.
What counts as return: directly attributed revenue from discount codes and tracked links, the estimated value of content produced and repurposed in paid ads, the commercial value of reach and awareness for brand campaigns where a media-rate equivalent is the benchmark, and the long-term value of creator relationships built.
What counts as cost, the part most sources skip: creator fees (cash or gifted product at cost), product sent for seeding valued at cost price rather than retail, platform or agency fees, paid amplification or whitelisting, and internal staff time.
A return calculated only against creator fees overstates the result. A brand that pays a creator $500 and ignores the $300 in product, the $100 in platform access, and two hours of a $60,000-salary employee's time is measuring a fraction of the true cost against the full return.
Why ROI Is Harder to Measure Here Than in Paid Media
In paid search or paid social, every click is tracked, every conversion is attributed to an ad ID, and the path from spend to sale is reconstructed automatically.
Influencer marketing does not work that way, and the gap creates a real influencer marketing measurement problem even for teams that are trying to track it properly.
The effect is not always clickable. A viewer watches a creator use a product in a recipe video, doesn't click a link, and three days later searches the brand name, lands on the site, and buys. Last-click reporting attributes that sale to organic search and gives the campaign no credit, even though the video is why the viewer searched in the first place.
Multi-device journeys break attribution. Discovery happens on a phone during a commute, while the purchase happens on a laptop two days later. The tracking pixel fires on the laptop, which has no record of the phone session, so the creator's contribution is invisible.
Codes and links undercount. A viewer sees a creator's discount code, forgets it, searches the brand directly, and buys at full price; or remembers the code but uses it only on a second visit, after the attribution window has closed. Every code-based or link-based method undercounts the true effect this way.
Last-click attribution assigns sales elsewhere.Influencer content sits at the awareness and consideration stage, while last-click tools credit whatever the customer touched last, usually paid search or direct, rather than the post that started the journey.
Marketers themselves rank this among their main obstacles: in the Influencer Marketing Hub Benchmark Report, measuring ROI and attribution complexity together make up 15.84% of the challenges they report, and the difficulty persists even for well-resourced teams.
Much of the most visible discussion on this topic comes from people asking whether influencer marketing works at all, which is a fair reaction to how hard the effect is to see. The honest position is that influencer marketing has a structural attribution problem no single method fully solves, and the realistic goal is to close the gap as far as possible by layering methods.
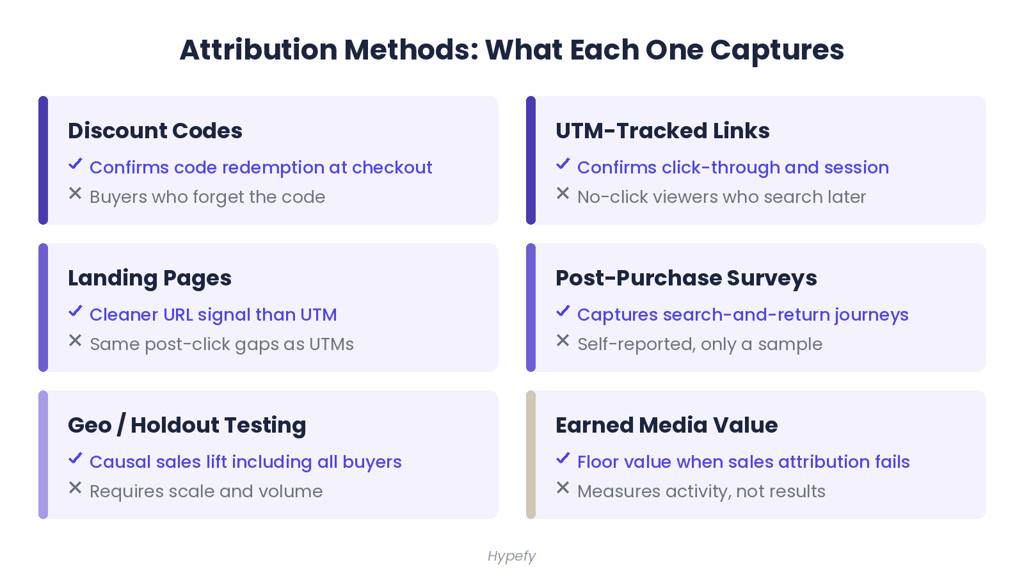
No single method captures the full effect. The practical approach is to use two or three methods whose gaps do not overlap, so the blind spots in one are partially covered by another.
No single attribution method captures the full effect, so the reliable approach layers two or three until their blind spots overlap.
1. Unique Discount Codes
Give each creator a unique code (SARAH20, MIKE15) and track redemptions in the eCommerce backend. This is the most accessible method and the most widely used.
What it proves: a viewer saw the creator's content and used the code at checkout.
What it misses: everyone who saw the content and bought without using the code, because they forgot it, searched the brand directly, or found the product later through another channel. Codes undercount true attributed volume, often substantially, and the gap widens for higher-consideration products with longer purchase journeys.
Use with: a UTM-tracked link in the bio or story so clicks register even when codes are not redeemed.
2. UTM-Tracked Links
Add UTM parameters to the creator's link and track traffic and conversions in Google Analytics or the equivalent.
What it proves: a click came from a specific creator's post and led to a session that converted.
What it misses: anyone who saw the post, didn't click, and found the brand later through search or a direct visit. In-app browser tracking is also limited on iOS, which has reduced pixel reliability since iOS 14. Links capture a different population than codes, typically more impulsive, shorter-journey buyers.
Use with: discount codes to triangulate. If the code shows 40 redemptions and the link shows 30 conversions, the true attributed number is likely above both.
3. Dedicated Landing Pages
Build a landing page specific to the creator or campaign that tracks all traffic arriving at that URL.
What it proves: a viewer navigated to that specific URL, a cleaner signal than a UTM because it takes typing or clicking the exact address.
What it misses: the same post-click gaps as UTM links, and like them it does nothing for search-driven purchases. Best suited to campaigns where the creator shows the URL in an on-screen graphic or link.
4. Post-Purchase Surveys
Add a single question at checkout or in the post-purchase email, "How did you first hear about us?", with "creator" or "influencer" as one of the options.
What it proves: self-reported attribution that catches the search-and-return journeys codes and links miss.
What it misses: only a minority of buyers complete the survey, so the data is a sample, and memory is imperfect, with customers tending to name the most recent touchpoint rather than the first. Treat it as directional rather than exact.
Use with: codes and links, as a cross-check. If codes and links show 60 attributed sales and surveys name the influencer as the first touchpoint for a quarter of that month's buyers, the true influenced volume is likely well above 60.
5. Holdout or Geo Testing
Run the campaign in some markets and not others, then compare the sales lift between the two groups over the campaign window.
What it proves: the campaign's causal effect, including purchases that codes, links, and surveys miss, which makes it the most reliable method available.
What it misses: it needs scale, enough markets, history, and volume to detect a signal above normal variance, so it is out of reach for most small and mid-market campaigns. It also misses the long tail of content that keeps circulating after the window closes.
6. Modelled or Media Value Approaches
For brand awareness campaigns where direct sales attribution is not the goal, use an earned media value (EMV) or CPM equivalent to estimate the value of the reach generated.
What it proves: the reach had a media-equivalent cost, giving the campaign a floor value even when sales attribution is incomplete.
What it misses: EMV says nothing about purchase intent, brand lift, or actual commercial return. It is a proxy for the value of reach rather than a measure of return, and works best as a supporting metric alongside the others.
Before using the ROI calculator: have your all-in campaign cost (including product, platform fees, and internal time), your attributed revenue from codes or links, and a rough estimate of survey-based uplift if you have it. The ROI calculator handles the arithmetic once those inputs are ready.
What Is a Good ROI for Influencer Marketing?
Influencer marketing scores a short-term ROI index of 99 against an all-channel average of 100, and the highest long-term return of any media channel measured, according to theIPA Effectiveness Databank.
The short-term figure comes from 59 UK campaigns. Over the long term, based on 18 UK campaigns, the index reaches 151 against paid social's 77, with a multiplier of 3.35 against linear TV's 3.27.
A code or link report pulled soon after a campaign will look ordinary, while the full return builds over the months that follow.
The databank covers 220 campaigns from 144 brands across 36 sectors and 28 markets, with over £133 million in influencer spend, which is what makes it the one source here worth leaning on.
This is also why the per-dollar "averages" that circulate online should be treated carefully. The widely-quoted figures come from self-reported survey data rather than audited results, and even at face value they have three problems:
They mix campaign types. A single average blends awareness campaigns measured on reach with conversion campaigns measured on sales, so it is accurate for neither.
They rely on self-reporting. Most come from brands reporting what they believe their return was rather than audited results. The IPA data is the exception, modelled from actual campaigns, which is why it carries more weight.
They rarely state which costs were included. An average that counts only creator fees looks far better than one that also includes product, platform fees, and internal time, and studies seldom say which they used.
A more useful benchmark than any industry average is your own paid channels, measured on the same cost and attribution basis.
If paid social returns 3x in your category, influencer marketing should clear 4 to 5x to justify the extra management overhead; if paid social returns 8x, the bar sits higher. That gives you a target grounded in your own margins rather than an average built on a different cost basis.
3 Metrics That Tell You Something
Influencer marketing metrics are more useful grouped by campaign goal than listed flat, because a metric that means little for an awareness campaign can be the one that matters most for a conversion campaign.
1. Awareness Campaigns
The metrics that matter for awareness campaigns are:
Reach, the number of unique accounts that saw the content
Share of voice, how often the brand comes up in creator conversations compared with competitors
Brand search lift, whether searches for the brand name rose during and after the campaign
What they don't tell you is whether any of that reach turned into interest, since high reach with weak engagement is exposure with no sign that anyone acted on it.
2. Engagement Campaigns
The metrics that matter for engagement campaigns are:
Engagement rate
Saves, as a purchase-intent signal
Comment quality, since specific product questions and repeat engagement mark a genuinely interested audience
Shares, which show content worth passing on
A save means the viewer bookmarked the post to come back to it later.Instagram says likes, saves, and shares are the most important actions it predicts when ranking Explore, which recommends posts from accounts the viewer doesn't follow yet, so saves help a post reach people outside the creator's audience.
Engagement shows interest rather than purchases, so check it against the conversion metrics below before treating a campaign as a sales success.
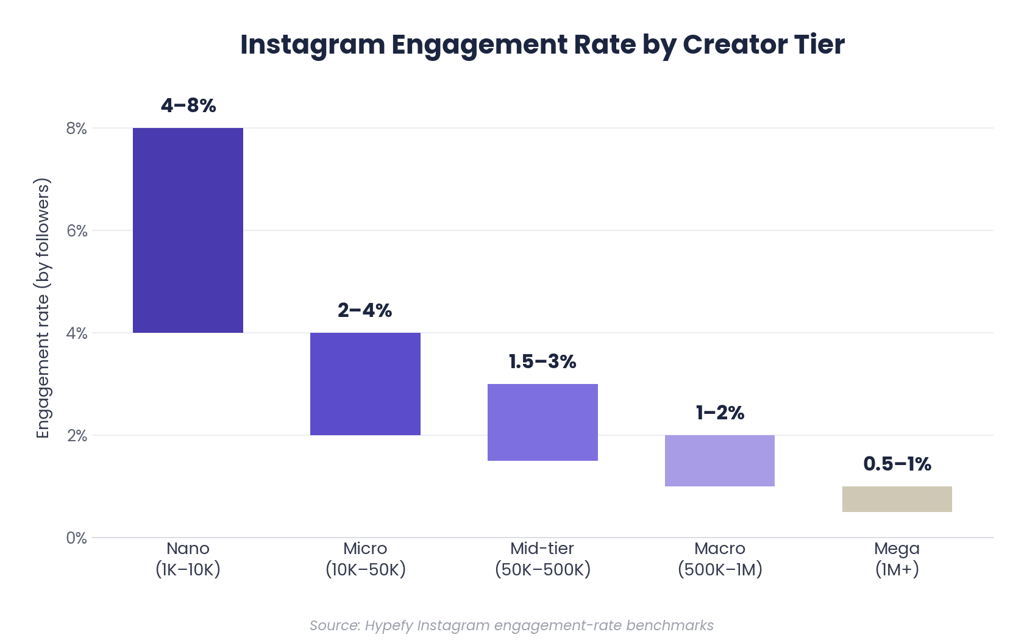
On engagement rate itself, the formula you use matters. Measured against followers, it is the figure anyone can calculate from public data, and it runs from roughly 4–8% for nano accounts down to 0.5–1% for mega accounts, so a rate only means something against its own tier.
Measured against reach, it shows what share of the people who actually saw a post responded, which is the truer read once you have the account's own numbers. Use the follower-based figure to compare creators before a campaign and the reach-based figure to judge how a post performed.
3. Conversion Campaigns
The metrics that matter for conversion campaigns are:
Discount code redemptions
UTM-tracked conversions
Cost per acquisition (CPA) by creator
Post-purchase survey attribution
Repurchase rate of influencer-attributed customers compared with other channels
Average order value, which often differs between influencer-driven and paid-social buyers
What they don't tell you on their own is the full effect. For the attribution reasons above, tracked conversions are a floor, so a modest code count doesn't mean the campaign underperformed.
How to Improve Influencer Marketing ROI
The levers below are ordered by how much difference they make in practice.
Creator tier. Tier is the biggest lever, and engagement runs opposite to price. Nano and micro accounts typically postengagement rates of 4–8% and 2–4%, against 0.5–1% for mega accounts, while their fees are a fraction of the size.
A nano creator can earn six to twelve times the engagement rate of a mega account, so for conversion campaigns the smaller tiers usually win on ROI even when they lose on raw reach.
Launch timing. Timing moves cost more than most teams expect. Across22,571 completed posts,
Hypefy's data shows cost per engagement swinging about 1.6x over the year, from a spring low to a late-autumn high, for the same brief.
Shifting a launch out of the Q4 crush and into spring returns roughly 60% more engagement for the same spend, a lever that costs nothing but a look at the calendar.
Platform and format. Format choice compounds the tier effect.
Carousels and short video outperform single images, and TikTok tends to run higher engagement than Instagram for the same creator.
Match the format to the goal, video for reach and saveable carousels for consideration, and the response rate rises before any budget changes.
Spread budget across more creators. More small, well-matched creators beat one large name at the same cost.
The IPA's cross-industry data found no reliable correlation between how much a campaign spent and the return it earned; what predicted results was the fit between brand and creator.
Ten aligned micro creators give more coverage, more reusable content, and less single-point risk than one macro placement for the same fee.
Negotiate against a benchmark. A creator without a reference will anchor to their rate card.
Completed-deal data gives you a floor to negotiate toward: Hypefy'sCEE benchmarks put cost per engagement between €0.31 and €0.62 depending on the market, so a quote well outside its market's band needs a reason.
Western European markets run several times higher, so the band to compare against is the one for the market you are buying in instead of a single global figure.
TheCPM calculator turns a quoted fee into a cost-per-thousand you can compare directly.
Reuse the content in paid media. One fee can produce more than one placement.
A creator's organic post, run as a paid social ad, extends a single fee across a larger audience and a longer window, and creator-made content usually carries the native feel that paid audiences respond to.
Treating each licensed asset as reusable across paid, organic, and email spreads that one cost across several placements.
Model your expected return before briefing any creator with theROI calculator.
Measuring ROI on B2B Influencer Campaigns
B2B influencer campaigns need a different measure from consumer ones, because the sales cycle is long enough to defeat campaign-window attribution.
Engagement runs opposite to price, which is why smaller tiers often win on ROI even when they lose on reach.
A deal that starts with a creator's post often closes six to eighteen months later, so a revenue loop measured around a six-week campaign misses most of what the campaign actually influenced.
The audience is smaller and more concentrated, so the numbers look different. Engagement rates and absolute volumes both come in below consumer benchmarks, which makes consumer ER ranges the wrong yardstick.
A few hundred of the right senior buyers can matter more than tens of thousands of general followers.
Pipeline influence rather than direct sales is usually the honest measure. The practical metrics are:
Content-driven inbound, whether traffic from the creator's audience turned into contact-form submissions, demo requests, or newsletter sign-ups
Pipeline influence, whether a "How did you hear about us?" field in your customer relationship management (CRM) system shows creator mentions
Lead attribution, the marketing-qualified leads (MQLs) and sales-qualified leads (SQLs) tracked over a rolling 90- or 180-day window rather than the campaign window
Where direct revenue can't be tied to a single post, the more defensible read is the quality of the audience reached, its seniority, company size, and fit with your ideal customer profile (ICP).
For the full B2B strategy, theB2B influencer marketing guide covers creator selection, platform choice (LinkedIn versus niche podcasts versus industry YouTube), and how to frame the investment internally when direct attribution is not possible.
How Hypefy Reports Campaign Results
Hypefy collects performance data per post and per creator across Instagram and TikTok, including reach, engagement, cost per engagement, and content output, in one place, so the inputs for the ROI calculation are already assembled rather than pulled together by hand from creator screenshots and platform exports after the fact.
The platform does not claim to solve the attribution problem, since no tool does. What it removes is the data-assembly work that sits between running a campaign and calculating what it returned.
Influencer marketing ROI is the return a campaign generates relative to its total cost, written as (total return − total cost) ÷ total cost × 100.
Total cost has to include creator fees, product, platform fees, paid amplification, and internal time, rather than creator fees alone.
2. How do you calculate influencer marketing ROI?
Add up all campaign costs, attribute revenue through discount codes, UTM links, landing pages, and post-purchase surveys, then divide the attributed return by total cost and multiply by 100.
Expressed as a multiple, it is simply total return divided by total cost.
3. What is a good ROI for influencer marketing?
There is no single reliable per-dollar figure.
The most rigorous independent data, the IPA Effectiveness Databank, puts influencer ROI about at the all-channel average in the short term and the strongest of any channel over the long term.
The more useful benchmark is your own paid channels measured on the same cost and attribution basis.
4. Does influencer marketing really pay off?
For most brands with reasonable creator-product fit and basic attribution, yes.
The IPA Effectiveness Databank found strong long-term payback and average short-term payback across 220 actual campaigns, and campaigns that look average in the short term tend to show their strongest returns over the long term.
5. What is the average ROI of influencer marketing?
There isn't a dependable single average, and the per-dollar figures that circulate online don't trace back to a primary source.
The one rigorous read, from the IPA, is that short-term ROI sits about at the all-channel average while long-term ROI is the highest of any channel measured. Treat any single "industry average" as directional at best.
6. How do you track influencer marketing without a discount code?
You can track it with UTM-tagged links, dedicated landing pages, and post-purchase surveys asking how the customer first heard about the brand.
For larger programmes, geo or holdout testing measures the sales lift directly. Layer two or three methods, since each one misses something the others catch.
7. What is the ROI of B2B influencer marketing?
In B2B, direct revenue attribution to a single post is rarely achievable when sales cycles run six to eighteen months.
Measure content-driven inbound leads, pipeline influence recorded in the CRM, and the quality of the audience reached, such as seniority and fit with your ideal customer profile.
8. Why can so few brands measure influencer marketing ROI?
Because influencer content sits at the awareness stage: viewers discover products in-feed, search the brand later on another device, and buy through a channel that takes the last-click credit.
Even well-run campaigns with basic tracking undercount the true effect.
9. Which creator tier gives the best return?
No tier gives the best return by default. The IPA found that influencer ROI depends more on the fit between brand and creator than on how much a campaign spends, so the best-returning tier is the one whose creators match your audience.
Smaller tiers are the cheaper place to test that fit. Hypefy's engagement rate benchmarks put nano accounts at 4–8% against 0.5–1% for mega accounts, andInfluencer Marketing Hub puts nano fees at $10 to $100 per Instagram post against $10,000 and up for mega creators, so test more than one tier and compare the results before committing budget.
10. How long should you wait before measuring a campaign?
Measure once when the campaign window closes and again a few months later, because content keeps circulating, search lift persists, and second-visit purchases keep adding up.
The IPA data puts influencer ROI at about the channel average in the short term and the highest of any channel over the long term, so a report pulled right after the campaign understates the full return.
About the Author
Kristina Macekovic
Strategist at Hypefy
Kristina Maceković is a Strategist at Hypefy, a company revolutionizing influencer marketing with AI. With a background in program management and technical consulting, including roles at emerging technology companies Span and bonsai.tech, Kristina brings a strong understanding of technology and data-driven strategies. Her insights help B2B marketing professionals navigate the evolving landscape of influencer marketing and leverage innovative solutions for exceptional ROI.