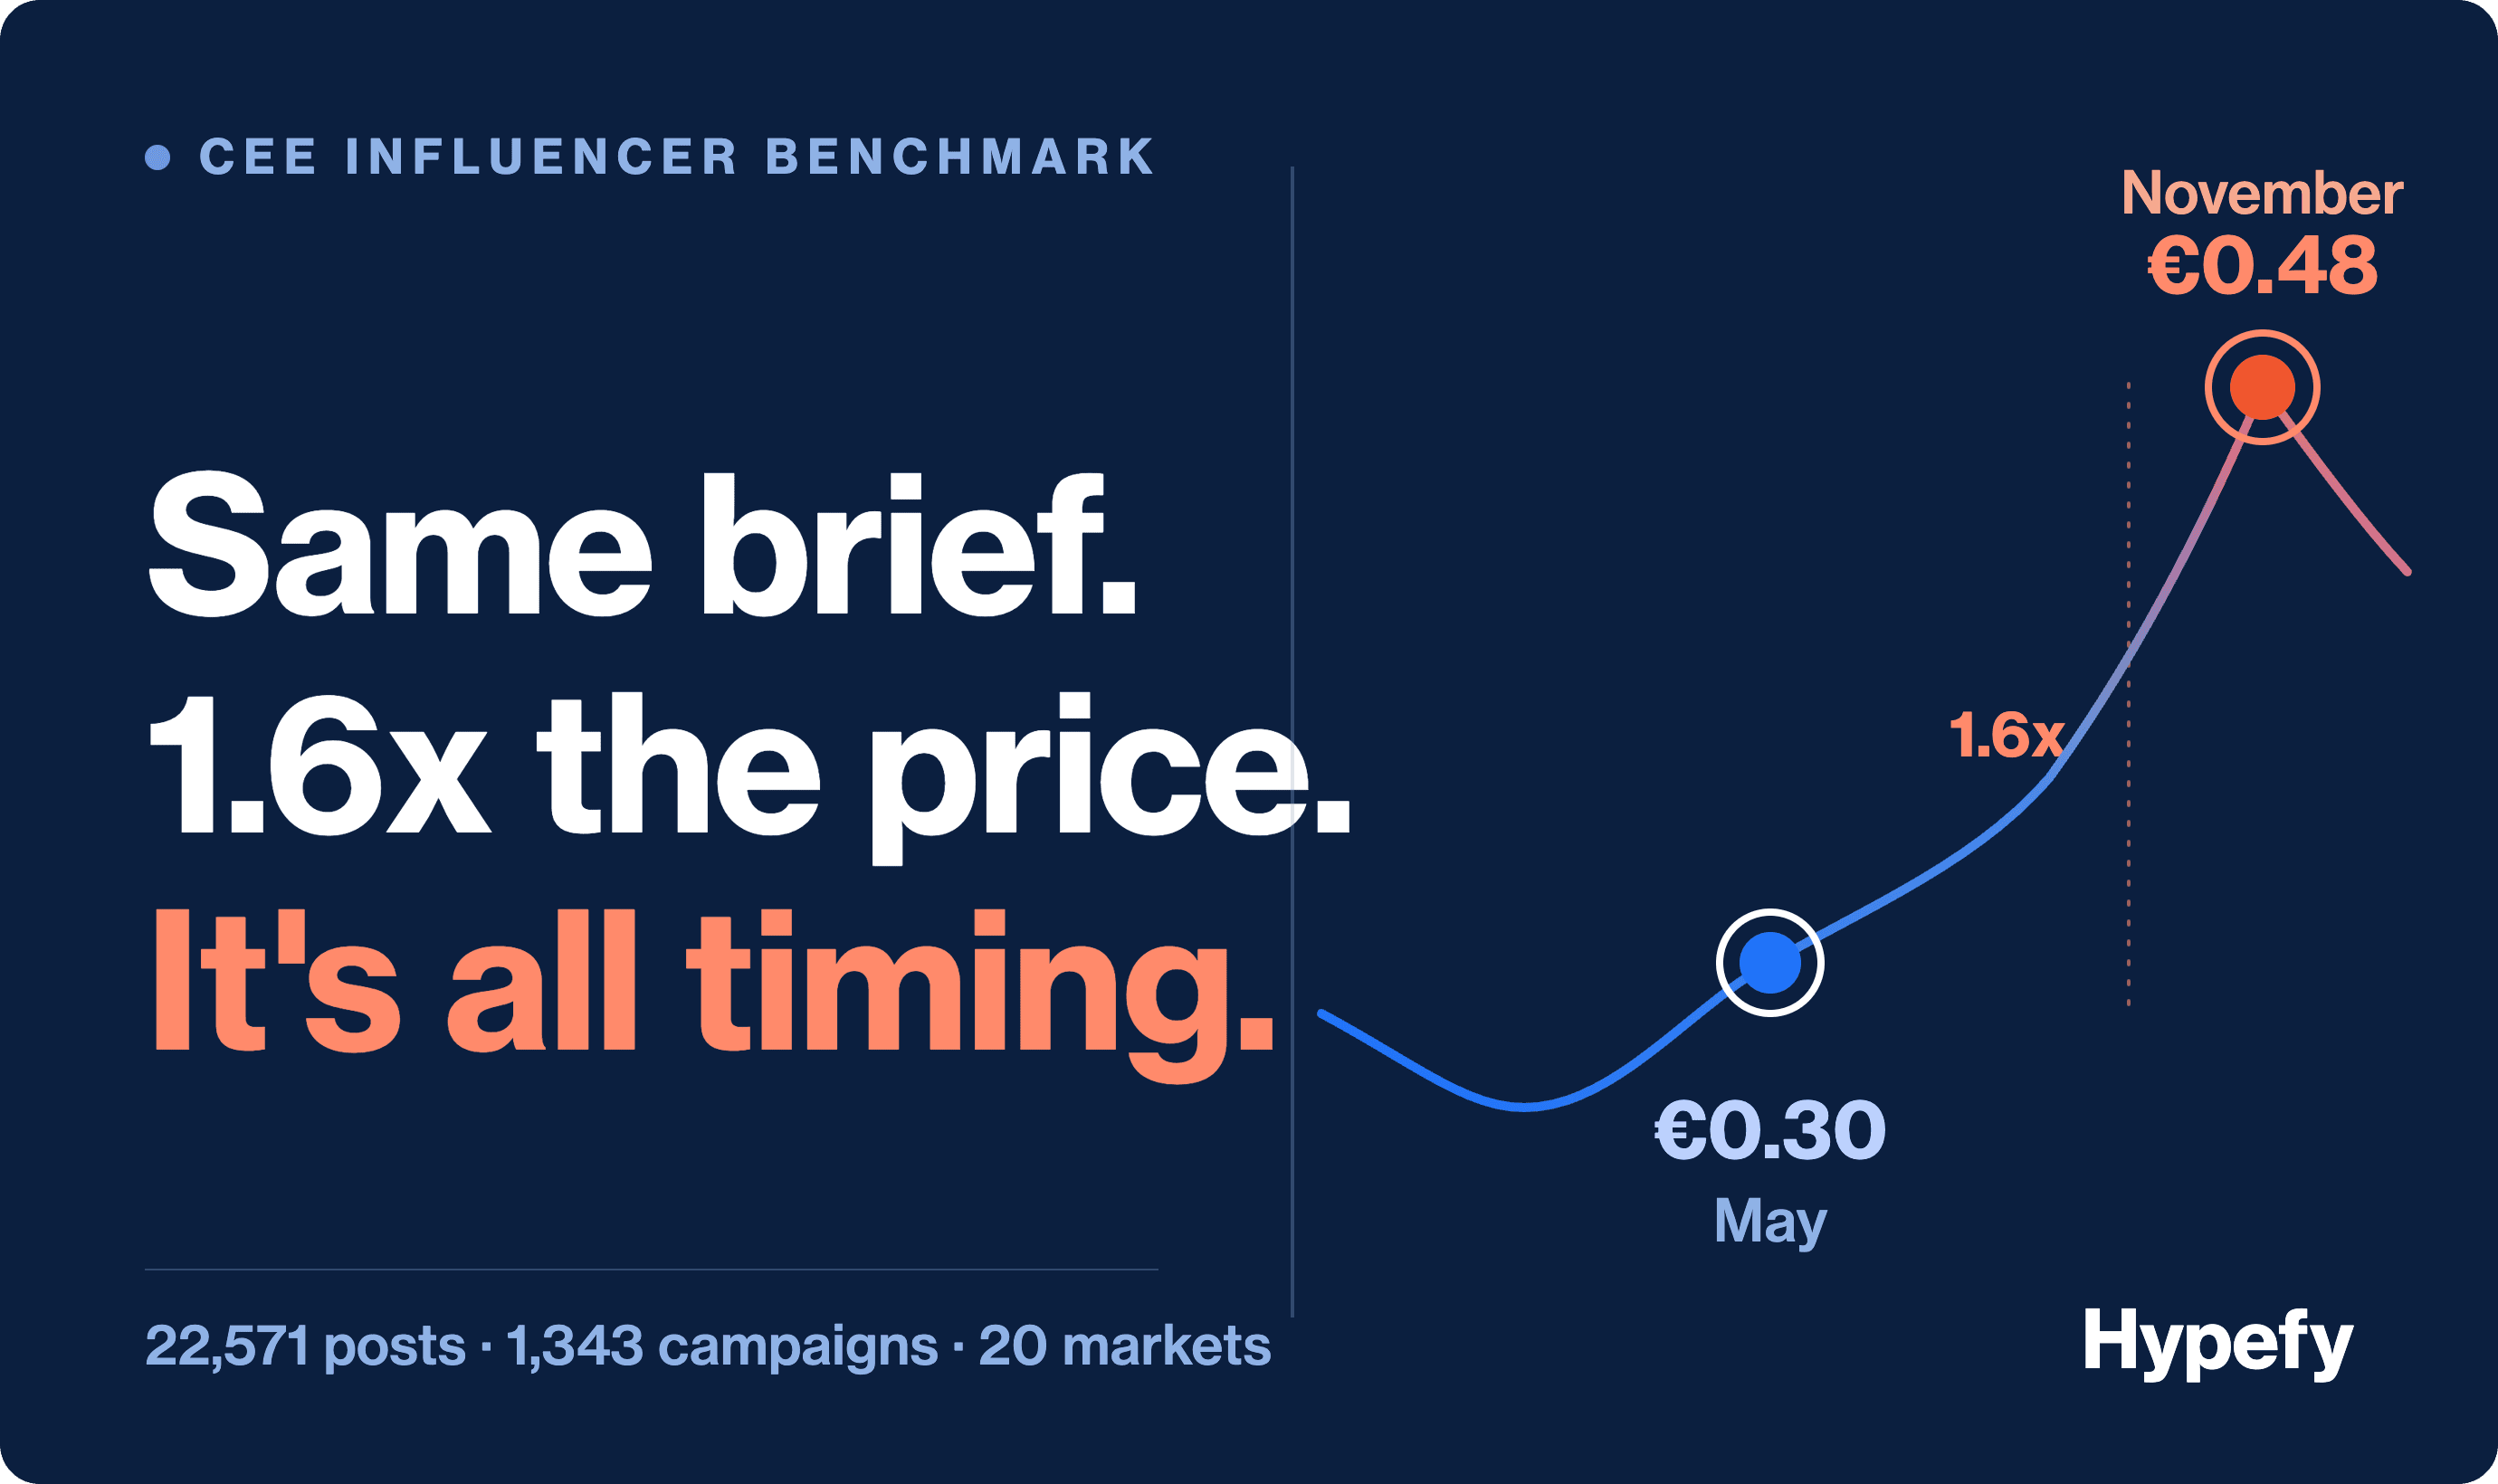
Run one brief through the calendar while holding markets, creator tiers, platforms, and deliverables constant.
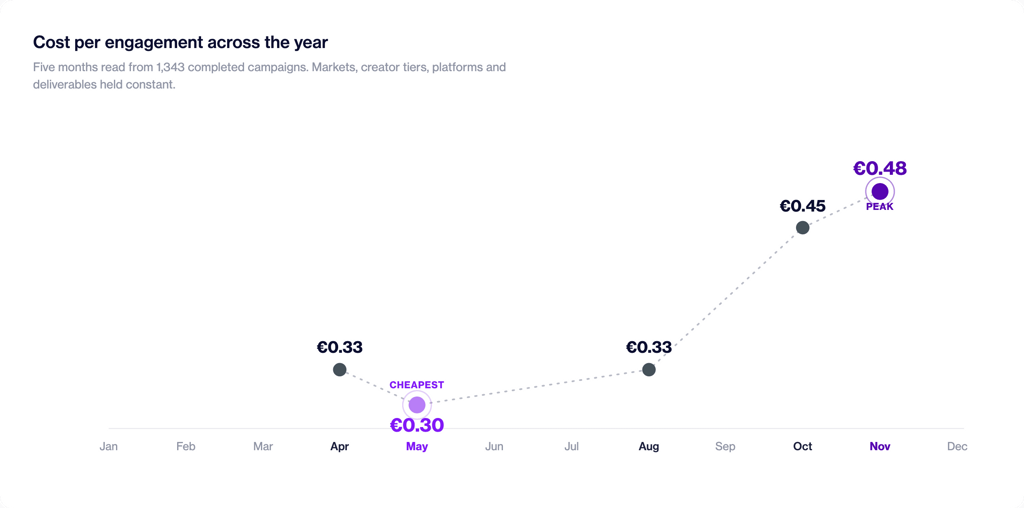
Launched in May it costs €0.30 per engagement, and launched in November the same engagement costs €0.48.
Nothing about the campaign changed except the date on the media plan.
That 1.6x swing comes out of the seasonality benchmark in the CEE Influencer Benchmark, measured across all 20 markets in the dataset, and it makes launch timing one of the few budget levers that costs nothing to pull.
The Calendar Has a Price Curve
Cost per engagement moves through the year in a recognizable shape.
The cheapest engagement of the year sits in spring, and the most expensive arrives in autumn, when November tops the year at €0.48 against May’s €0.30.
The months in between rise and fall along a curve, close enough to the average through the middle of the year that they reward tactical timing rather than a wholesale calendar redesign. The report plots all twelve with a reading for each.
The shape held across two full annual cycles in the data, which matters. A single expensive November could be an accident of a few large campaigns. Two shaped the same way point to market structure.
Get the full 12-month table with a reading for every month. Download the free report
Paid Social Planners Already Live by This Curve
None of this will surprise anyone who buys paid social. Meta CPMs climb every fourth quarter as holiday advertisers flood the auction.
Superads, which benchmarks Meta ad costs across $3 billion in tracked spend, measured the global median CPM jumping 20.7% in a single month into a November 2025 peak of $24.26, before dipping sharply in December.
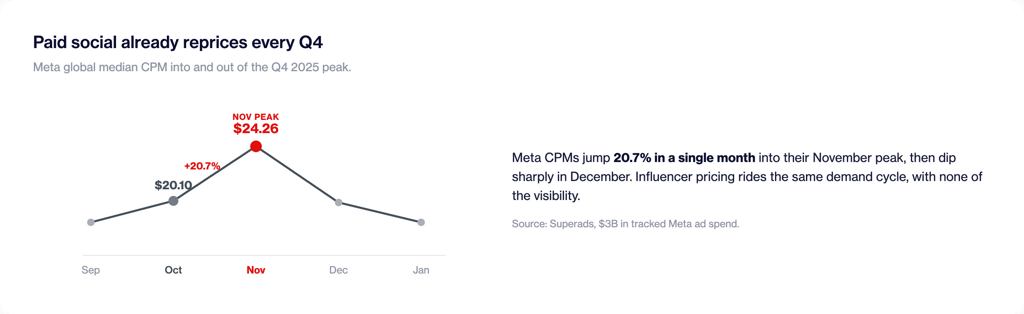
Auction-based media reprices in real time, and every buyer watches it happen on a dashboard.
Influencer pricing rides the same demand cycle with none of the visibility.
And these are largely the same platforms, since most of the posts in our dataset run on Instagram. Rates are negotiated one deal at a time, quotes are confidential, and no dashboard warns a brand that influencer rates just climbed 60% between spring and Q4.
The 1.6x seasonal spread in our data is the influencer market’s version of the Q4 CPM spike, measured for the first time from completed deals instead of estimated from rate cards. The premium was always there and simply never appeared on anyone’s screen.
Where the November Premium Comes From
Q4 retail demand builds through the autumn, and rates respond the way prices always respond when demand rises against a fixed supply of creators.
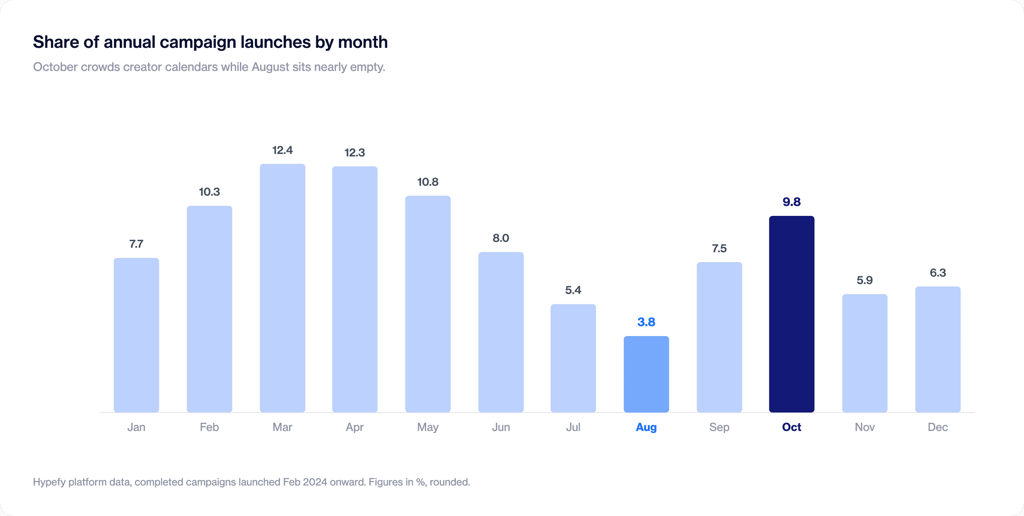
The pattern shows up first in the calendar. Across campaigns launched since February 2024, October carries 9.6% of the year’s launches, roughly two and a half times August’s share, as brands rush to land before the holiday window.
November itself runs below average on launch volume, so the premium isn’t a simple case of more campaigns bidding.
Two things lift November’s cost instead. October’s flagships still occupy the strongest creators, so a November brief competes for whoever is left. And with few campaigns launching, the ones that do tend to skew larger and more urgent, which pulls the median up on its own.
The lesson for a planner is the same either way. Arriving in November means paying more for less choice, so a Q4 flagship needs that premium built into its budget from the start rather than discovered during negotiations.
August Is the Quiet Bargain
Conventional planning writes off late summer as dead air, with audiences on vacation and feeds quiet. The launch data shows how completely the industry believes it.
August is the least-used launch month in the entire dataset, accounting for just 3.7% of annual campaign launches, less than half of a typical month’s share.
That desertion is the opportunity.
Almost nobody briefs in August, so the few brands that do negotiate against a wide-open creator pool with no competitive pressure from other campaigns. The audience, meanwhile, never actually left. Feeds do not close for the summer.
August carries a second, quieter advantage. It is the last clear window before autumn demand arrives, which makes it the natural moment to lock the creators you will want for a Q4 flagship, while they are still easy to reach and easy to negotiate with. A planner who treats August as vacation cover for the team gives up both edges at once.
Q4 flagship on the plan? Lock creators before August closes and book a demo
Timing Is a Real Lever and a Secondary One
A note on proportions keeps this honest.
Platform choice, creator tier, and market selection all move cost more than the calendar does, so those decisions come first. A brief pointed at the wrong tier in the wrong market will not be rescued by a clever launch date.
The curve is also a 20-market average, so treat it as the shape to expect across the region rather than a Croatia-specific or Serbia-specific calendar. Your own months will move with the markets and creators you pick.
What makes timing worth planning around is its price. Shifting a launch from November to May costs a planning conversation and returns roughly 60% more engagement for the same spend.
Every other lever in a media plan asks for a trade.
Cheaper markets change the audience, a cheaper tier shrinks each creator’s reach, and a cheaper format usually means rethinking the creative.
Timing asks for nothing except that someone looks at a calendar in January rather than a brief in October.
How to Build the Year Around the Curve
Three habits fall out of the seasonal pattern.
Launch in spring, when rates sit at their lowest, and treat the exact month as a planning decision the full calendar can sharpen.
Use the quiet late-summer stretch for efficient work while competitors sit out the month, and lock your Q4 creators well before the autumn premium arrives.
And avoid running always-on programs without a seasonal plan, because a calendar that ignores the curve quietly pays the 1.6x spread on a rolling basis, invisible inside a blended annual CPE that nobody thought to split by month.
Fold these three rules into your standard campaign planning checklist so the calendar check happens on every brief.
Use Hypefy’s ROI calculator to model May against November before locking the calendar.
Get the Full Calendar
The CEE Influencer Benchmark includes the complete month-by-month CPE table with a reading for every month, alongside country pricing bands, tier benchmarks, and the outreach funnel.
Built on 22,571 completed posts from 1,343 campaigns, every price negotiated and paid.