Most brands running influencer campaigns across several markets set their CEE budgets by starting from the Western European figure and applying a modest discount. Our campaign data shows that the habit routinely leads to overspending and makes it possible to measure by how much.
Western benchmark reports tend to focus on the US, the UK, and the largest EU markets, and Central and Eastern Europe rarely appears in them.
Brands planning campaigns in Belgrade, Zagreb, or Budapest are left without reliable numbers. The creators they negotiate with, meanwhile, know the prevailing rates well, so the brand starts every negotiation at a disadvantage.
We built the CEE Influencer Benchmark report to fill that gap. It’s the first benchmark report based on real campaign data from the region, drawn from 22,571 completed posts across 1,343 campaigns in 20 markets between February 2024 and July 2026, and every figure in it comes from a completed campaign.
Download the CEE Influencer Benchmark report for free
Why Hypefy’s Data Is Different
Published influencer benchmarks usually draw on one of two sources:
Surveys of what marketers say they spend or plan to spend
Rate estimates modeled from public profile data.
Neither method records a transaction that took place, which makes both better suited to general context than to pricing decisions.
This report is built on the prices brands negotiated and paid, captured as each campaign closed, along with the performance those prices bought.
The data comes from Hypefy, an AI-driven influencer marketing platform that connects more than 1,000 brands and agencies across CEE and Western Europe with a database of over 350M+ million creators.
Because the platform handles briefing, pricing, contracting, and performance tracking, the report can follow each campaign from the first outreach email to the final engagement count.
The Same Engagement Costs Nearly Four Times More in the West
The report's central finding is the gap between the two regions.
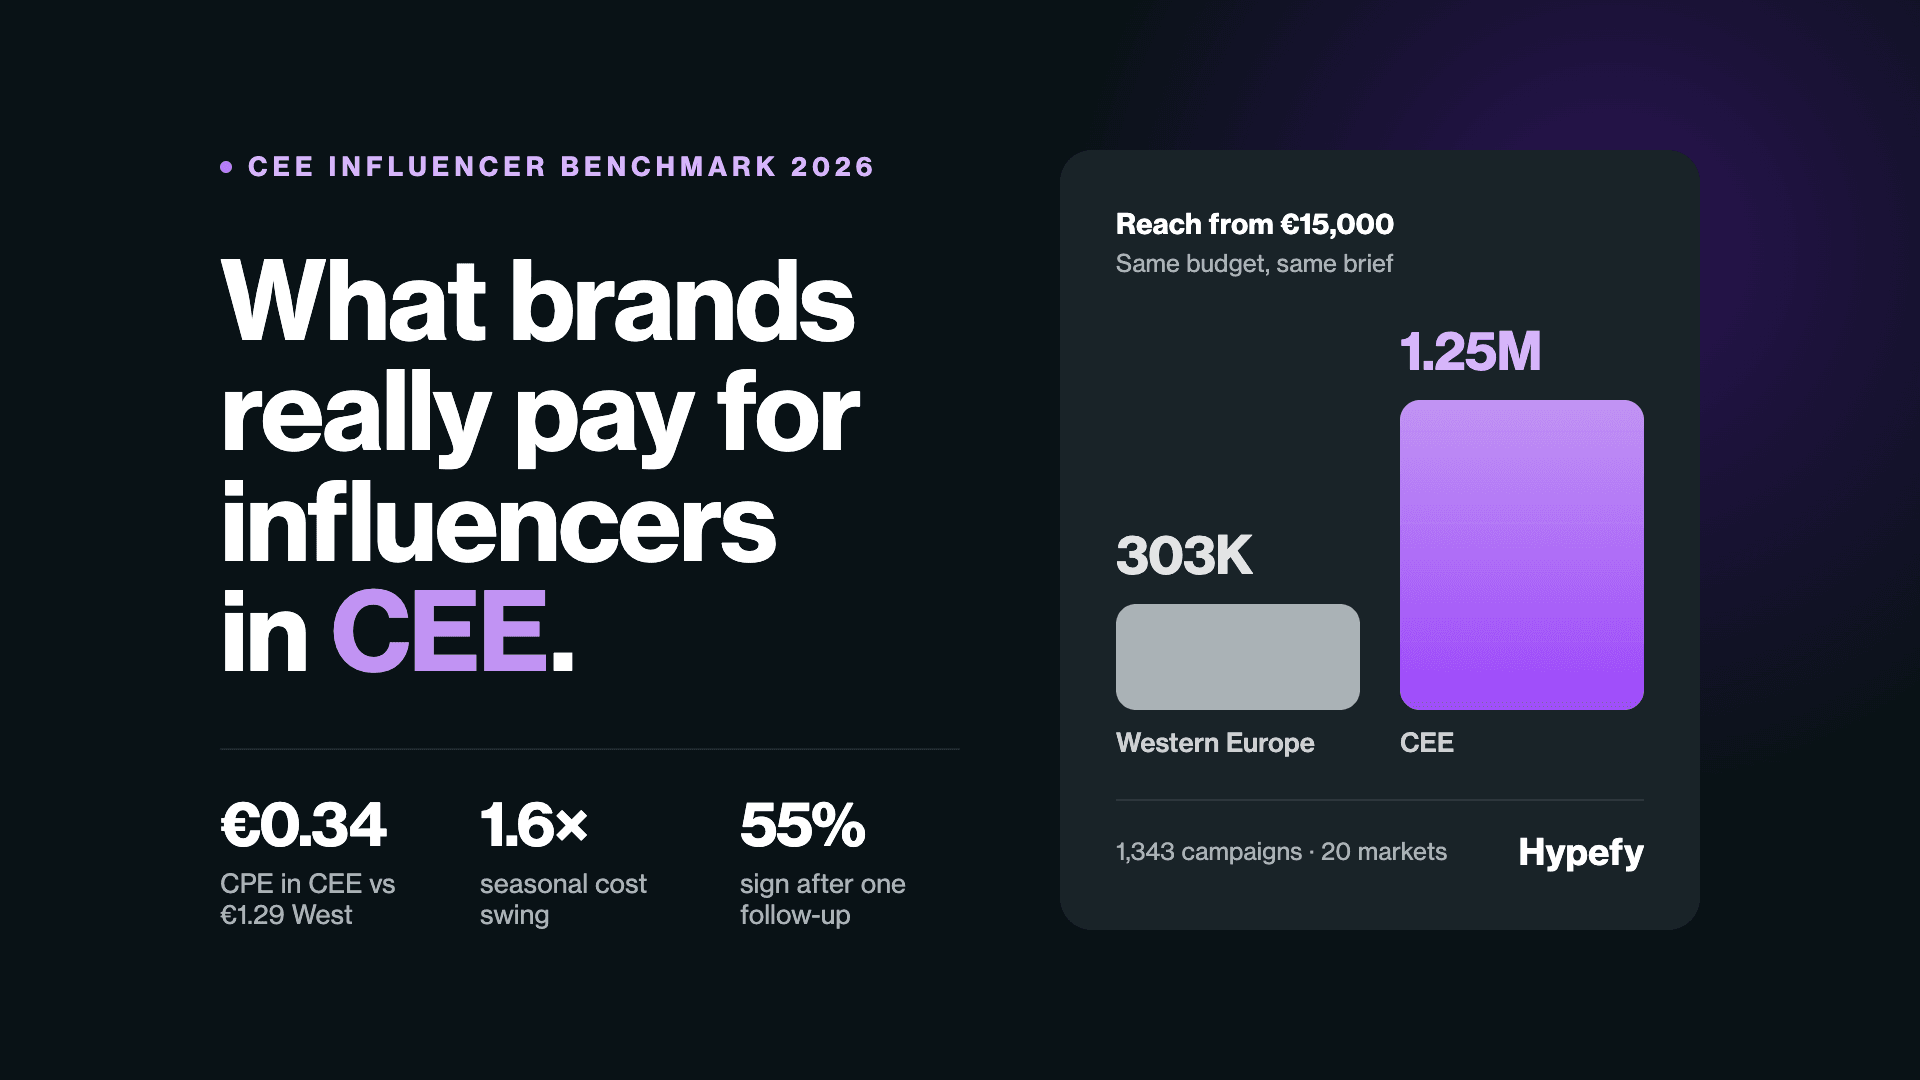
An engagement costs €0.34 in CEE and €1.29 in Western Europe, a 3.8x difference for matched briefs, creator profiles, and engagement levels.
Even the most expensive CEE market costs less per engagement than the cheapest Western one.
The gap reflects market maturity.
In CEE, creators outnumber the brands competing for them, so the scarcity premium that inflates Western rates hasn’t formed. CEE audiences engage just as readily, and brands pay less to reach them.
A €15,000 budget buys a reach of roughly 303,000 at Western rates and about 1.25 million at CEE rates, which changes how a campaign should be sized from the start.
Costs also vary within the region, where cost per engagement runs from €0.31 to €0.62 depending on the market.
The full report breaks that range down market by market. If you are planning in the region, see how Hypefy runs influencer campaigns in Croatia and Serbia.
Bigger Creators Cost More and Engage Less
Follower count is a weak predictor of impact.
Engagement per follower falls sharply as accounts grow, from 13.5% at the nano tier to 1.3% at the mega tier.
Prices rise over the same range.
On TikTok, the average mega-tier post costs €940, for an audience that engages far less per follower.
Mega accounts also carry about 14% doubtful followers, meaning accounts flagged as inactive, bots, or fakes.
For these reasons, the report makes the case for building CEE briefs around smaller creators and adding larger tiers only when the campaign needs more reach. The full tier table in the report shows where that balance sits on each platform.
The report also benchmarks each price against fair value, a modeled price based on follower count, past engagement, market demand, and recent comparable deals.
Overpayment is concentrated in one tier on one platform, which commands 2.1 times fair value, the highest ratio in the data.
Timing Shifts Your Costs by 1.6x
Launch timing also affects cost.
With every other factor held constant, cost per engagement ranges from €0.30 in the cheapest month to €0.48 in the most expensive, a 1.6x swing.
Rates peak during the year's busiest stretch, when retail demand floods the market.
The full report maps the cost of every month, so you can see where the cheapest launch window falls and how early a peak-season campaign needs to be booked.
We break down the seasonal pattern month by month in May or November: Timing Shifts Your Influencer CPE by 1.6x.
CEE Creators Are Harder to Sign
Signing creators is where many CEE campaign plans run into trouble.
Across 8,277 influencers contacted in 44 markets, 89% opened the first email, 60% replied, and 19% of all those contacted ultimately signed.
The biggest drop comes between first contact and signature, and much of it can be recovered, because a follow-up converts 55% of creators who didn’t respond the first time.
Response rates also differ sharply by region.
The best-converting CEE market closes 46% of follow-ups, compared with 74% in the UK.
An outreach plan built on Western response assumptions will fall roughly half short in CEE.
From Benchmarks to a Working Brief
The last section of the report turns these findings into planning tools.
It starts with seven rules to apply to every brief.
A campaign planning table then matches campaign types to budget, platform, tier mix, and timing, and a checklist for multi-market campaigns covers the errors that cost brands the most.
The tables are designed to stay open as a reference during live briefings and budget discussions.
The report is aimed at brands and agencies with a stake in CEE pricing.
Western brands considering the region as a growth market can estimate the likely return before committing budget, and regional brands can use it as a defensible baseline in negotiations.
Agencies that run campaigns across several markets will find country-level data they can use to allocate client budgets more efficiently.
Get the Full Report
CEE rates have stayed low partly because no public benchmark existed to test them.
That’s starting to change as more Western brands enter the region and local agencies professionalize, and the deals signed now will become the reference points that later entrants negotiate against.
The full CEE Influencer Benchmark includes the complete CPE table by market, the budget-to-reach ladder, tier and fair-value benchmarks, a month-by-month calendar, and follow-up conversion rates by country.
Download the CEE Influencer Benchmark to plan your next CEE campaign around the prices brands paid.