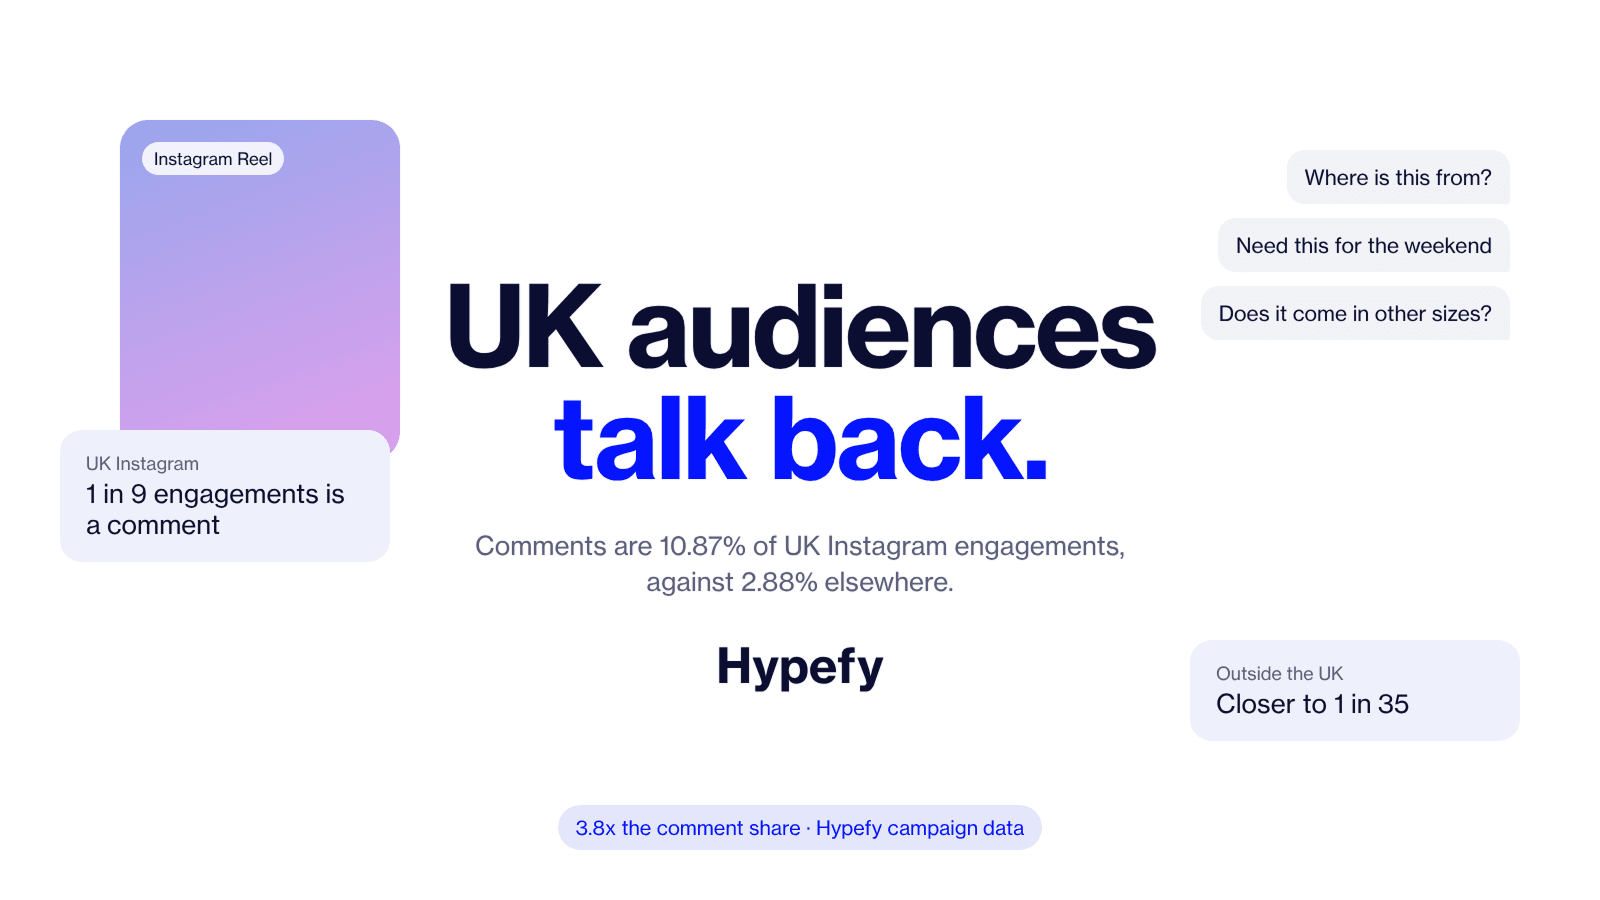
Comments make up 10.87% of engagements on UK Instagram posts. Outside the UK, the same measurement returns 2.88%.
That's 3.8 times the share, and it's the most useful thing we found about UK audiences.
What makes it worth knowing is the price a comment carries for the person leaving it.
Writing one takes a few seconds and a sentence, and it puts your name on that sentence in public, under the post, where other people can see it.
A like asks for none of that. When a market's engagement mix tilts this far toward the more expensive action, the audience is doing something different with the content.
This matters because of what post 1 in this series found. UK creators reach a smaller share of their following than creators in any other market we measure.
The UK hands you a smaller audience, and the people in it are paying closer attention than the people in the larger audiences elsewhere. Those two findings have to be read together or the UK looks like a market to skip.
See the Engagement Benchmarks.
Get the UK Influencer Benchmark ReportWhy Comment Share Is Worth Measuring at All
Engagement rate treats every interaction as one unit.
A like and a comment both add one to the numerator, which is convenient and hides the thing you want to know.
Anyone who's run a campaign knows how different the two feel when the results come in, and standard engagement rate erases the difference.
Comment share puts it back. It asks what proportion of the response was the effortful kind, which gets you closer to whether an audience was paying attention.
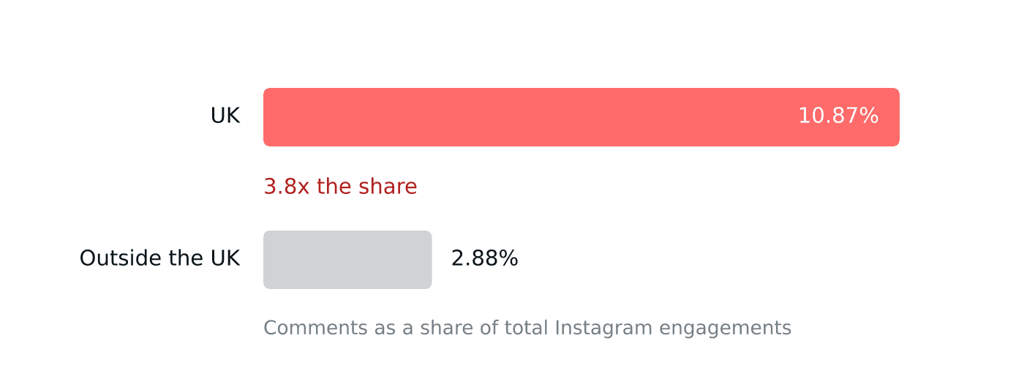
At 10.87% against 2.88%, roughly one in nine UK Instagram engagements is a comment. Outside the UK it's closer to one in thirty-five.
The pattern is broad-based. Of the 30 UK Instagram campaigns in our data, 25 are above the non-UK median, so no single campaign is driving it.
Comment share is comments divided by total engagements on completed posts. These figures are Instagram only, UK against non-UK, with the post counts on each side in the report. The wider UK dataset is 356 posts across both platforms, and counts vary by measure.
Why the Comparison Is Network-Matched
This is the part of the finding that took the most care, and it's worth explaining, because it's where most published engagement comparisons fall down.
UK post volume is 85% Instagram.
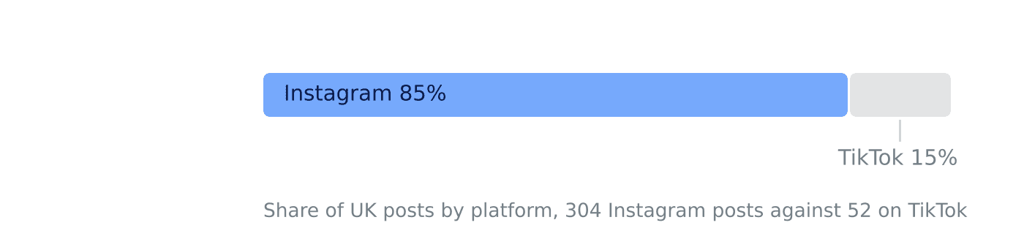
Instagram audiences comment considerably more than TikTok audiences do, in every cut of our data, which looks like a property of the platforms rather than of any market.
Compare a heavily Instagram market against a heavily TikTok one on raw comment share and you'll find a difference, but the difference will be the platform mix wearing a market's name.
The 10.87% against 2.88% comparison holds the network constant. UK Instagram posts against non-UK Instagram posts, on the same metric.
What's left once you control for platform is the audience, which is the only part worth reporting.
That's the habit worth borrowing from this post.
Any engagement comparison across markets that doesn't say which networks it's comparing is telling you about media mix.
Run the numbers against reach and see what the response was made of.
Open the Instagram Engagement Rate CalculatorReading This Next to the Reach Finding
Put the two UK findings side by side and the market makes sense.
On distribution, the UK is the weakest market in our data, with creators reaching 8.2% to 14.1% of their following against 29.6% to 70.0% in CEE.
What the audience does once the post arrives runs the other way, and comment share is the clearest version of that. The smaller audience a UK post reaches engages above benchmark on both platforms.
The difficulty in the UK is getting in front of people at all, and what happens after that is the part working in your favor.
That has a direct consequence for how a UK campaign gets judged.
If your reporting template was built on another market, reach and impressions will come in low, engagement quality will come in high, and whoever reads the report will anchor on the first number.
It's worth handling in the template rather than in the campaign.
Compare UK Engagement Against CEE.
Download the CEE Benchmark ReportWhat to Change in How You Report a UK Campaign
Report comment share as its own line. Comments divided by total engagements, stated as a percentage, sitting next to the 10.87% benchmark so the number has something to be measured against. Folded into a single engagement rate, it disappears.
Set the reach expectation before the campaign runs. A UK campaign benchmarked on another market's reach will read as underperformance while performing normally. Put the expected range in the plan, so the low number is one people were told about in advance.
Pick the metric that matches the brief and keep it. Post 2 in this series covers which cost metric fits which objective, and why to choose before the results are in.
Read what the comments say. A high comment share is worth something only if the comments are about the product, the brand, or the creator's actual point. A hundred heart-eye emoji still count as a hundred comments. This is the one part of engagement quality that no benchmark can do for you.
Hold platform decisions separately. The comment share finding describes UK audiences on Instagram. On its own it isn't an argument for or against any platform in a UK plan, and treating it as one skips several steps.
Filter a UK shortlist on engagement behavior before follower count.
Open the Influencer Discovery toolUK Instagram Comment Share FAQs
1. Why do comments take up more of UK engagement?
We can measure that they do rather than why.
What the data rules out is platform mix, since the comparison is Instagram against Instagram.
2. Is a high comment rate better than a high like rate?
For most objectives, a high comment rate is better than a high like rate, because comments cost the reader more and signal attention rather than recognition.
The exception is pure awareness, where reach is what you bought and the response is a bonus.
3. Does this mean UK influencer marketing works better?
It means the UK behaves differently.
Audiences respond harder per person reached, and creators reach fewer people to begin with. Post 1 covers the reach side.
4. How do I measure comment share on a campaign?
Total comments divided by total engagements, per post and then across the campaign.
Do it per post first, since one viral comment section can carry a campaign average and hide four quiet posts.